This evidence contradicts the narrative told by those who track the value of aggregate median
income from the 1970s to the present and claim that most Americans have made little progress for
decades. That time series cannot convey the income path of an average household because the set
of households used in that series changes so drastically over any extended period. By contrast, the
data used here report the median incomes of cohorts of households based on the age of the heads
of those households each year, as those household-heads age.
Yeah, I read that, but they are trying to disprove a narrative that nobody defended.
The narrative that Americans made little progress for decades in the 80-90s about progress compared to the people working in previous years. And it holds, given the study. Their data says that an American working from 1975 did exactly the same amount of money during his working years as an American that started working in 1980, 9185, 1990 and 1995.
Which means the median expected lifetime income did not grow.
It’s a narrative drum which is constantly beat… that “most americans saw no economic growth over decades!”
The reality is, basically EVERYONE saw robust economic growth through the 80’s and 90’s, with their incomes rising throughout their lives.
And this is why the narrative that no one experienced any growth for decades didn’t match up with folks’ experiences and contemporary polling… because folks were in fact getting raises, and making more money as they worked.
And again, this is in contrast to more recent years since the turn of the century, where such growth has slowed. It’s that more recent trend which is the problem, as THAT is what makes folks pissed off… when they keep working, but aren’t getting raises, and aren’t progressing.
Given that these numbers are inflation adjusted, why would you expect their lifetime incomes to grow?
[quote=“Timex, post:83, topic:130173, full:true”]Given that these numbers are inflation adjusted, why would you expect their lifetime incomes to grow?
[/quote]
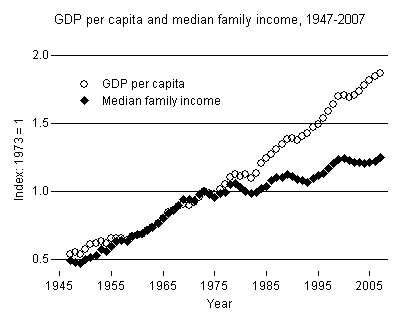
Because that’s what happened 1945-1975. Heavily. And in other periods of big GDP growth. That the US GDP grew as much as it did while keeping the lifetime adjusted to inflation income flat is extremely unusual and a symptom the policies did not improve the life of average citizens, as they were improved in other periods of growth.
Historically, huge GDP growth is correlated with the improvement of the living standards of the average citizen (bigger lifetime income adjusted). that it did not happen during the Reaganite period and inmediatedly afterwards points that there’s something fundamentally wrong, at least compared to other periods, about that growth and how it was structured.
That is exactly what economist criticize of that period.
No it didn’t.
When you extend the trendlines back to the 40’s, they are the same ones you see after 1975.
Now, not all the datasets go back that far, but for the ones that do, there’s no sudden flattening that happens at 1975… The only one that really shows such a thing is the one that breaks down income by gender, where you see male income levels flattening quite a bit after the 60’s compared to the previous two decades… but this is obviously due to a dramatic increase in women in the workplace, which is also shown on the graph.
You are telling me the trendline of Real Family income 1940-1975 is the same as the one 1975-2000? Because I’m seeing about a double growth rate at least.
I think you’re basically guaranteed to see SOME flattening, as the early period was a goldenage of economic growth for the US.
I think it’d be totally unrealistic to expect a perpetual continuation of the post-war period in the US, forever.
Unfortunately, prior to that period, there doesn’t seem to be a lot of data, so it’s difficult to measure outside of this period of unprecedented economic prosperity… also, at the end of it, the US was the richest and most powerful nation in the world.
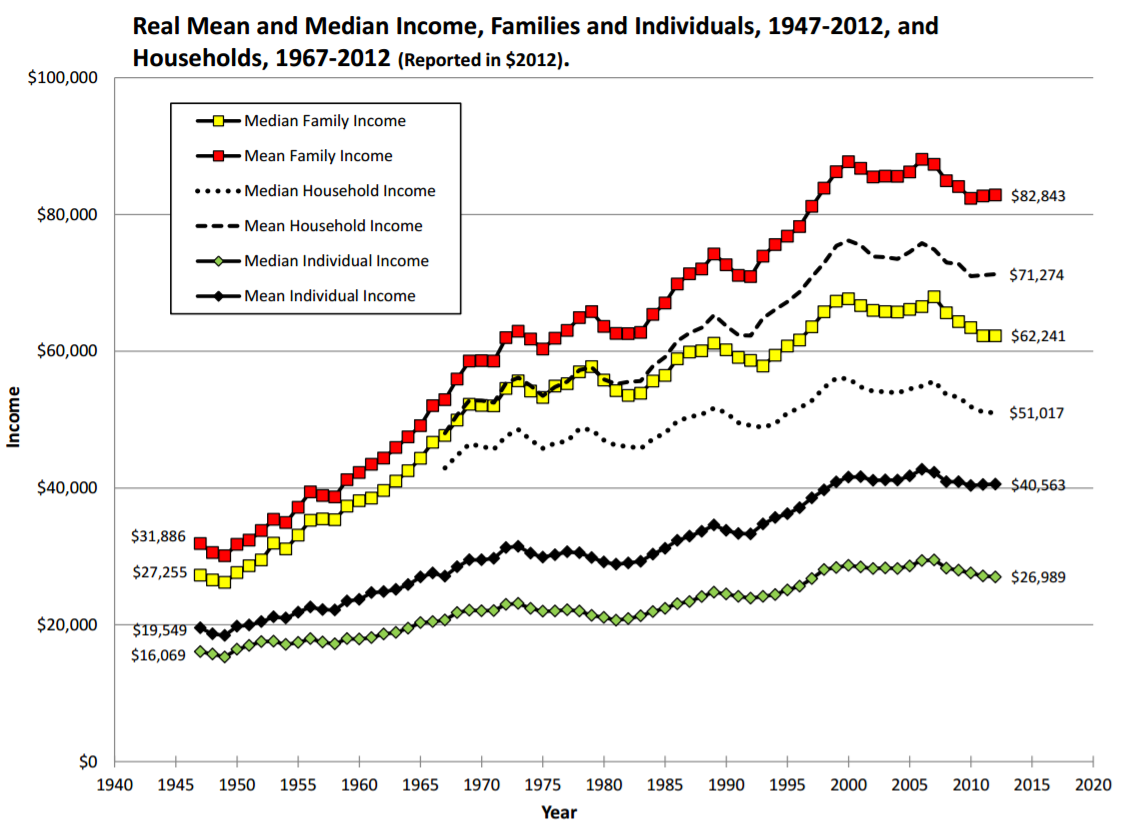
Although, honestly, looking at the actual data… there doesn’t really seem to be a great slowdown at all when you look at the real median individual income:
That’s fine. Correlation does not mean causation, and the fact that inequality rose and salary to GDP flatline after the rise of economic liberalism and deregulation might be a coincidence (but please note that there’s a plausible cause along with the correlation, at least).
But just don’t say income growth did not flatline, because it did (mostly flatlined, ok, but it decoupled from GDP growth for the first time in detailed record). The analysis can be more nuanced, of course, but the data is the data, and the article you presented to challenge this notion did nothing to really challenge it.
But it really didn’t.
In 1940 it was around $20k… in 2000 it was around $40k… and in 1970 it was at about the halfway point, at $30k.
Decoupling from GDP growth doesn’t really matter… and a growth in inequality doesn’t really matter either. The fact that some other dude got even richer doesn’t impact you, unless it affects inflation and lowers your buying power. But since we’re measuring REAL income, that’s accounted for.
Following the 1945 to 1970 trendline we should be at $55k at least. It’s harder to see the slowdown because the overall growth is flatter, but it’s there in pretty much the same strength.
1945 to 1970 > $20k to $32k, or $12k in 25 years.
1970 to 1995 >$32k to $36k, or $4k in 25 years
1995 to 2010 > $36k to $40k, or $4k in 25 years.
Moreover, when you adjust per age cohort (as the study you first linked shows) you see a total flatline. I wished that study started in 1945 to be able to compare growth before and after, though.
You’re picking specific dates to tell the story you want… but you can look at the overall graph and see that.
For instance, we’re not talking about time past 2000, because I have specifically acknowledged that beyond that point you saw a dramatic flattening. That’s what Shapiro’s analysis showed, and it contrasts to the prior period.
You’re cutting things off at 95, but that ignores the massive growth that took place at the end of the 90’s and ended up putting income growth back on track… You then slip this into the next chunk of time, where that huge gain is hidden by the lack of growth in the new century.
But when you look at the period from the 40’s through the end of the century, you see a fairly steady level of overall growth. It had more recessions and dips in the period after the 60’s, as there were basically none in the period immediately following WWII.
For the time periods you picked, you broke it off at 95.
Ignore everything after 2000, because it totally did flatten after that point for some reason.
But go up until that point. Break up the period between that and the beginning, and you see a fairly linear progression (albeit with more recessions and recoveries in the second half).
No, that’s not what Shapiro’s analysis suggests. His analysis shows that for age cohorts they all enjoyed economic growth through the end of the century, contrasted with the period after 2000, where that growth flattened significantly.
And you can see that the dips in income match up with recessions.
[quote=“Timex, post:93, topic:130173, full:true”]No, that’s not what Shapiro’s analysis suggests. His analysis shows that for age cohorts they all enjoyed economic growth through the end of the century, contrasted with the period after 2000, where that growth flattened significantly.
[/quote]
I’m not saying that’s what the analysis suggest, but what the data shows. That median lifetime earnings did not grow at all during that period (contrasted to the small growth the median income per year shows) once you adjust for age cohort. That a 25-29 years old person was expected to earn exactly the same amount in 1975 as in 1991, and that correlation keeps steady as the cohorts age, with same median earnings at the same age ranges (while the unadjusted for age cohort total median does show some growth as you point out).
Now, whether there was a real expected lifetime income growth in the period 1945-1975 once you adjust for age cohort remains a question. The conventional wisdom is that the growth in median income in that period, when coupled with GDP, correlated exactly to that. But as the Shapiro analysis shows that real lifetime income growth might be nonexistent in the presence of median income growth, the correlation I spoke of might be off. That would be a very interesting study indeed.
It’s just a different facet of the data. Age tracked data is a specific view that highlights what individuals within the economy are actually experiencing. His analysis is only on the period after 1975, highlighting the difference between what we see prior to 2000, and what we see afterwards.
Also Tuesday night, during a segment with CNN’s Anderson Cooper, former Trump campaign adviser Jason Miller said Sessions “knocked away some of the hysteria from Kamala Harris and some of the Democrats who wanted to make this a big partisan show.”
CNN political analyst Kirsten Powers quickly seized on Miller’s use of “hysteria,” a word with historic sexist undertones grounded in a psychological disorder tied to women’s physiology.
“How was Senator Kamala Harris hysterical?” Powers asked.
Miller said he thought there was no real effort to get a real question answered.
“I think she asked a lot of questions,” Powers said. “She was very dogged. I wouldn’t say she was any more dogged than Senator Ron Wyden was, would you say that?” (Wyden also had a contentious exchange with Sessions.)
“I think she was hysterical,” Miller said. “I don’t think Senator Wyden was trying to get to the bottom of answers either.”
“But he wasn’t hysterical,” Powers said. “She was.”
The CNN commentator and Trump supporter then chimed in: “Hysteria is a neutral quality,” he said.
“And yet,” replied Powers, “it’s just women that usually are called hysterical.”
I’m shocked; I tell you, shocked, that a woman behaving in the exact same manner of a man is given a negative trait while the man doesn’t get the same label… also go Ron Wyden. At least one of my senators isn’t busy licking Trump’s boots.